USUS UKUKIndiaIndia

Every Question Helps You Learn

Join Us
Streak
Leading Streak Today
Your Streak Today
Streak
Leading Streak Today
Your Streak Today
Appropriate Chart/Graph
Why are charts and graphs used to present data? Find out in this quiz!

Appropriate Chart/Graph

This Biology quiz is called 'Appropriate Chart/Graph' and it has been written by teachers to help you if you are studying the subject at middle school. Playing educational quizzes is a fabulous way to learn if you are in the 6th, 7th or 8th grade - aged 11 to 14.

It costs only $12.50 per month to play this quiz and over 3,500 others that help you with your school work. You can subscribe on the page at Join Us

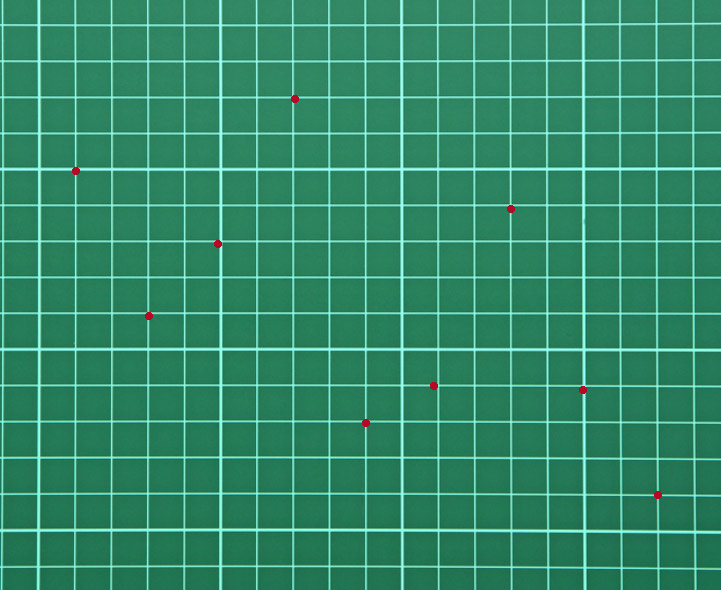
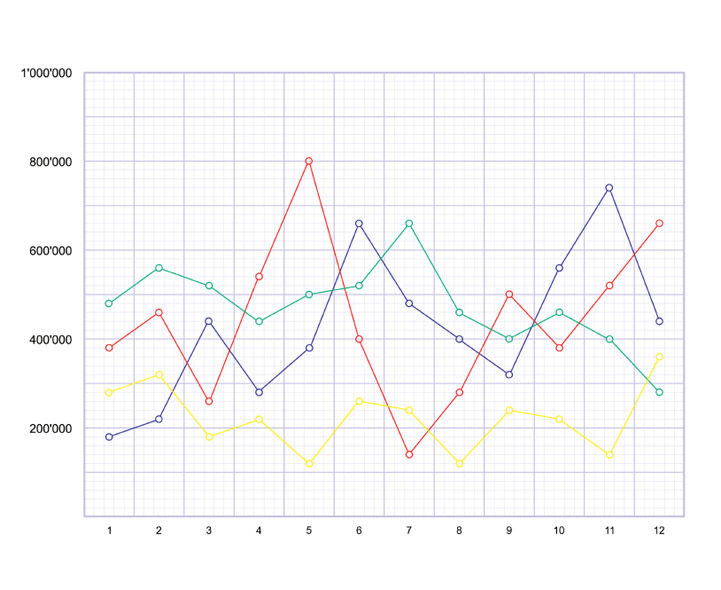
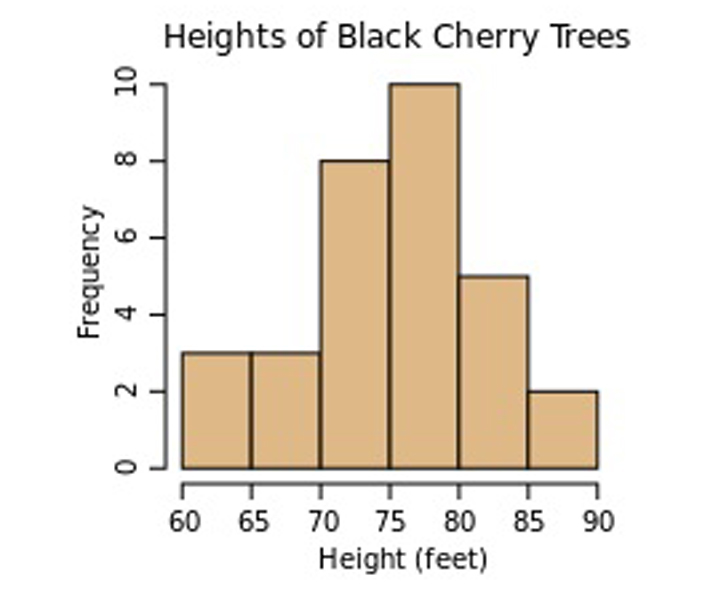
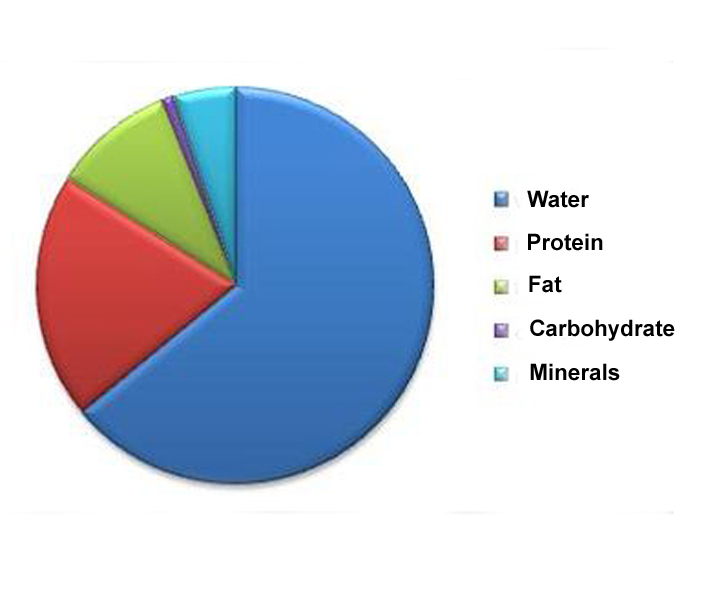
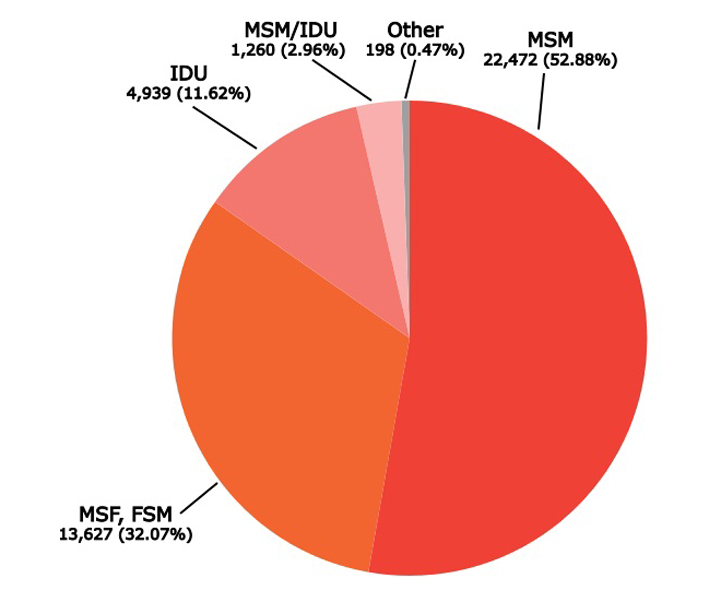
In this middle school Biology quiz we look at some of the many types of graphs and charts and find out how to choose the appropriate one to present different types of data. Scatter graphs, pie charts and bar charts are examples of some of the different ways used by scientists to present their data.

Please click on any of the smaller images below to get a larger picture.
1.
This is an example of which type of chart?
Line graph
Histogram
Bar chart
Pie chart
Looks like the pieces of a pie! Each piece represents a percentage of the pie. Half of the pie would be 50%
2.
Points just plotted without joining or bars is known as a ...
scatter graph
line graph
pie chart
bar chart
Scatter graphs are useful for spotting patterns in data
3.
Identify this type of chart.
Line graph
Bar chart
Histogram
Scatter graph
You can join the points in a line. Hence line graph
4.
Looking at this line graph covering a 12-hour period, which hour shows the highest amount?
3
5
7
11
Line graphs usually have a jagged appearance
5.
Looking at this histogram of the height of cherry trees, why is this a histogram and not a bar chart?
Photograph courtesy of Jtneill at Wikimedia Commons
Height is continuous data
Height is discontinuous data
The data is averaged
The data is accurate
Discontinuous data is presented in a bar chart
6.
What sort of chart is this?
Pie chart
Line graph
Bar chart
Scatter graph
Each bar is a different group of data
7.
Using this pie chart, showing the composition of the human body, which of the following is the body mainly made of?
Photograph courtesy of JenCom at Wikimedia Commons
Protein
Fat
Carbohydrate
Water
All humans are about 70% water!
8.
In the following pie chart, which has the largest percentage?
Photograph courtesy of Optigan13 at Wikimedia Commons
MSM
MSF
IDU
Other
Pie charts are great for showing percentages
9.
This chart is a type of...
bar chart
line graph
mean
data
In a true bar chart, there is a gap between each bar but you would not be penalized for missing out the gap in an exam or coursework
10.
This shows the population of a country as time goes on. The population is...
increasing
decreasing
the same
increasing and decreasing
It is drawn as a line graph because the population is known at any given time
Author:  Donna Maria Davidson

© Copyright 2016-2024 - Education Quizzes
Work Innovate Ltd - Design | Development | Marketing