Political Voting
Politics and Children
Firstly an apology: we usually keep the write-ups of our weekly surveys fairly light-hearted but today our younger readers might find this write-up about political voting is a little heavy-going…
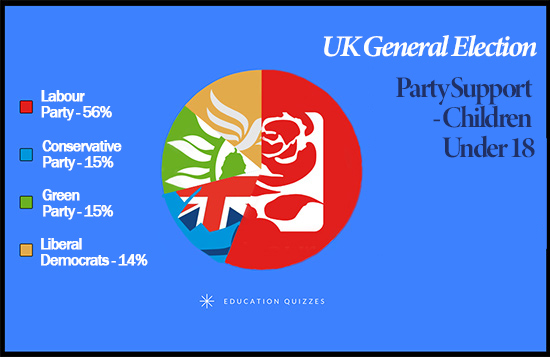
Earlier in the week we had a general election that was the most unpredictable and acrimonious in recent times but the Conservative Party triumphed with a stunning victory over their arch-rivals, the Labour Party. During the five weeks leading up to the election the entire country, including children, were bombarded with the policies of the leading parties and therefore we have seized the opportunity to compare the political views of the non-voting children with the voting adults. The graphs below show the results.
Here at Education Quizzes we are in the business of education, not politics, and for that reason we don’t profess to know the answers to political questions. However, we thought it might be fun to pose a question for each of the graphs below to see if you have the answers.
Don’t worry kids because next week we will be back on track with a light-hearted survey on favourite things at Christmas!

Our research shows that the Labour Party have more support amongst children under 18 than the rest of the parties put together. Why should this be?
The Green Party get considerably more support from the under 15s than they do from the 15 to 17 age group. Do younger children care more about environmental issues?
At the recent election, the Conservative Party got far more votes than the Labour Party but amongst children the overwhelming preference is for the Labour Party. Why should children prefer the Labour Party over the Conservatives?
During the election campaign, the Labour Party lost popularity amongst adults but gained popularity amongst children. What was it about the Labour campaign that was a turn-off for adults but was popular with children?
Notes about the Surveys
For the sake of clarity, all the figures in the above data are expressed in terms of percentages.
A total of 1,339 children participated in the surveys but some of the children came from outside of the UK and these were removed from the results.
The survey gave choices other than the four main parties who appear in the charts above but these were removed from the results in order to provide a direct comparison between the principal factions.


