UKUK USUSIndiaIndia

Every Question Helps You Learn

Join Us
Streak
Leading Streak Today
Your Streak Today
Streak
Leading Streak Today
Your Streak Today
Evidence for Climate Change
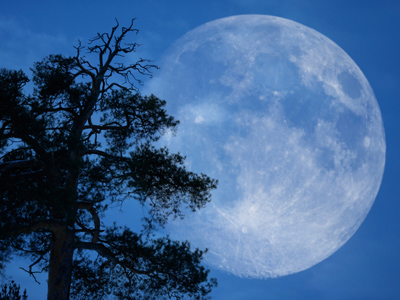
The oceans' tides are affected by the phases of the Moon.

Evidence for Climate Change

One of the main topics in GCSE Geography is climate change, or global warming. This is one of four quizzes on the subject and it looks specifically at the evidence for the theory of global warming.

How can you measure sea level change? Imagine you are standing at the beach with a ruler. The waves come in and out changing the sea level there over seconds. Each day the tidal cycle changes the sea level and that changes during the lunar cycle. Even If you can prove that the sea level has changed - is it really the sea level changing, or is the land rising or falling?

New technologies, including satellites, are allowing scientists to measure the small changes that show that the world's climate is altering faster than ever before. The main areas of evidence that you need to be aware of include sea level rise, global temperature rise, warming oceans, shrinking ice sheets, declining Artic sea ice, glacial retreat, extreme events, ocean acidification and decreased snow cover.

1 .
How might scientists monitor snow coverage?
Using satellites
Using anecdotal data from skiers and other mountain users
Using weather reports
Visiting all the places individually
NASA's Moderate Resolution Imaging Spectroradiometer collects data on the snow coverage from the Terra satellite
2 .
What is the evidence that anthropogenic (man-made) causes are behind the rise in CO2 levels?
CO2 levels have risen above 300ppm slightly in the past 100 years, before dipping back below in 2005 after carbon emissions were reduced
There is no scientific evidence, but anecdotal observation suggests we are to blame
CO2 levels have been rising since humans first appeared on Earth
CO2 levels have risen dramatically since the beginning of the industrial revolution and are higher than they've been in 650,000 years
For the past 60 or so years the trend in the graph has been an almost vertical rise in the amount of carbon in the atmosphere
3 .
What is the evidence for climate change from glaciers and ice sheets?
They are shrinking
They are expanding
They are remaining the same, with ice being formed at the same rate as it melts
They are moving faster, but not shrinking
Ice sheets are melting at an alarming rate. Greenland loses around 250 - 300 cubic kilometres of ice per year
4 .
The Earth's oceans are becoming more acidic. How have human actions caused this?
Removing coral has lead to the sea being unable to buffer itself
Increased fossil fuel burning has released more CO2 and other gases, making the oceans more acidic
Pollution draining off the land has included acids. These have lowered the oceans pH
Adding limestone and slaked lime to the waterways has dramatically lowered the pH
The amount of carbon (in the form of carbon dioxide) being absorbed by the upper layers of the ocean has increased by an estimated 2 billion tons per year
5 .
The extent and thickness of the Artic sea ice is reducing each year. But what other technique can be used on the ice to gather evidence for climate change?
Seal calving rates can be looked at
Soil trapped in the ice sheets can be monitored
The thickness of the ice above land at the North Pole can be measured
Ice cores can be studied
Ice cores can be used to show the amount of snow fall and the trapped air bubbles can be used to measure the atmospheric content going back thousands of years
6 .
How much have sea levels risen in the past 100 years?
1.7 cm
17 cm
170 cm
1.7 m
Whilst 17cm might not sound like much, it's double the rise of the previous century
7 .
Solar output is the amount of energy given off by the Sun. From 2007-2009 the solar output declined so much that this period is known as a solar minimum. What happened to the Earth's surface temperatures during this time?
They continued to rise
They fell slightly
They fell sharply
There was no change
Even during the solar minimum, average global surface temperatures continued to rise, demonstrating the insulating effects of the greenhouse gases
8 .
Why can't NASA's Moderate Resolution Imaging Spectroradiometer collect data on the snow coverage at the poles during their respective winters?
The extreme cold stops the sensors working
No one can practically work at the poles during the winter
There is no sunlight at the poles during their winters
The poles tilt away from the satellite
The lack of light means that for part of the year there is no way to gather the data on the poles, but at present scientists can still be sure that there is plenty of snow on the poles during the depths of winter
9 .
Extreme events are an obvious source of evidence for climate change. In terms of warmest summers on record what has been the trend in the twenty-first century?
There have been 2 of the warmest summers on records. 2 more have been the coldest on record
Only 1 summer has broken a record
5 summers have been the warmest on record
There has been a big increase in the number of warmest summers on record
Since 1981 twenty of the warmest years on record have occurred and ten of the warmest years on record occurred between 2002 and 2014
10 .
What part of the planet absorbs most of the temperature increase?
The core
The land masses
The polar icecaps
The oceans
The oceans are warming. Whilst the average rise is only very slight, it shows that the trend is that everything is getting warmer
You can find more about this topic by visiting BBC Bitesize - Climate change

Author:  Ruth M

© Copyright 2016-2024 - Education Quizzes
Work Innovate Ltd - Design | Development | Marketing